
FOR IMMEDIATE RELEASE…Vancouver, BC – November 28, 2023 – Gelum Resources Ltd., (the "Company" or "Gelum", CSE: GMR, OTCQB: GMRCF), through its option agreement with Wealth Minerals Ltd. (“Wealth”, or the “Optionee”, CSE: WML), has completed a 3D DC-resistivity and induced polarization (“DCIP”) survey over approximately 1.5 square kilometres of the main mineralized trend. Results indicate the strongest concentration of sulphides lies below and west of the limits of all completed drilling. Gold grades at Eldorado are highly correlated with concentration of sulphides, particularly arsenopyrite and stibnite, which occur within breccias and veins.
In late October, Gelum completed a six-hole, 1340-metre drill programme on the Eldorado Gold Property, exploring for high-grade gold mineralization (see news release dated October 16, 2023). Assays are pending.
The Eldorado Gold Property is located 22 kilometres north of the Bralorne mine, and 17 kilometres north of the community of Gold Bridge in the south Cariboo (Map 1). The 9028-hectare property covers multiple Minfile listings and two past-producing (1930s & 40s), small-scale gold mines that form the northern extent of the Bridge River-Bralorne/Pioneer orogenic gold system. Gold occurs in polymetallic sulphide veins and vein-stockworks within broad quartz-carbonate alteration in the Eldorado granodiorite stock and surrounding rocks. These units are complexly juxtaposed by numerous faults associated with regional-scale structures linked to gold mineralization. For detailed maps and project photos, please view and download our presentation on our website.
3D DCIP Survey Details
Gelum contracted Dias Geophysical Ltd. of Saskatchewan (“Dias”) to complete a 3D DC-resistivity and induced polarization (DCIP or “IP”) survey over approximately 1.5 square kilometres of the property (Map 1) between September 28th and October 18th, 2023. The goal of the 3D IP survey was to provide continuous coverage across the area to provide robust 3D inversion models of chargeability and resistivity to a depth of approximately 400 m. The geophysical program was completed using the DIAS32 acquisition system in conjunction with one Dias GS5000 25 kW transmitter. The IP survey was completed using a rolling distributed 3D array with a pole-dipole transmitter configuration that resulted in a near-surface resolution of approximately 12.5 by 25 metres.
Late summer forest fires and resultant access restrictions delayed the start of the survey, with even preliminary data not available until the drilling was near completion. As such, it could not be used to adjust the drill targeting as originally planned.
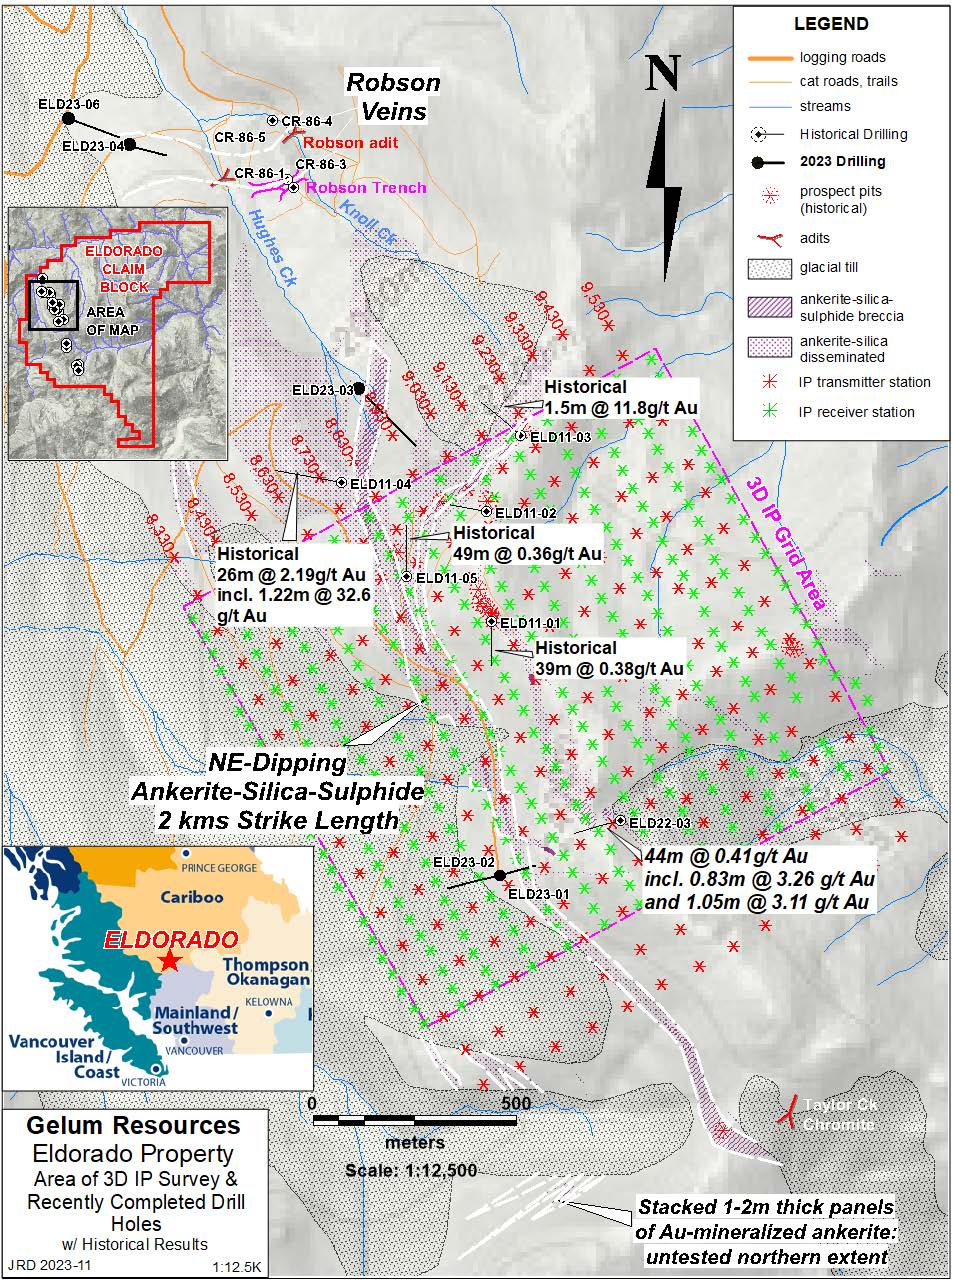
Map 1: Location and station array of the 3D IP grid, with recent drill holes and historical holes with significant intervals for context.
Dias completed 27 3D DCIP lines in a rolling distributed pole-dipole array in common voltage reference (CVR) mode. The survey layout was as follows:
- The survey was comprised of 27 lines, oriented northwest-southeast with an azimuth of 150° and spaced 50 m apart.
- Receiver stations were spaced 50 m apart and receiver lines were spaced 100 m apart.
- Transmitter stations were spaced 100 m apart and transmitter lines were spaced 100 m apart.
- Current injections lines were completed midpoint between consecutive receiver lines.
- Line lengths were adjusted to avoid treacherous areas where access was restricted and varied from 15 m from the center of the line up to 100 m at the edge of the grid.
- Current extensions were carried out off the ends of the survey lines to provide additional depth of investigation along the edge of the grid.
- A current remote electrode station was established approximately 1.8 km northeast of the grid.
Dias generated two sets of unconstrained 3D inversion models of resistivity and chargeability from the final processed data set. All sets of inversions were carried out using the SimPEG Decoupled inversion code (version 1.0 - https://www.simpeg.xyz/). The resulting models were gridded and trimmed using Geosoft Oasis software and then converted into the UBC-GIF Tensor Mesh format. The DC model is expressed in Ohm-m (resistivity model) and Siemens (conductivity model) and the IP model in mV/V.
The fine inversion models show coherent features that are well supported by geological data. However, and as is the case for any inversion, the level of confidence in the shape and amplitude of the geophysical features is lower along the edges of the survey grid than in the center. Depth of investigation was determined by observing the behaviour of the geophysical features centered on the survey grid. This depth is likely shallower along the edges of the models.
Strongest Anomaly Lies at Depth Below Drilling
The main northeast-dipping, sulphide-bearing, siliceous ankerite vein/breccia panel that is approximately 40-metres thick and intersected in at least three drill holes, including hole ELD22-03 (see news release dated March 6, 2023) has a strong low resistivity (i.e., conductive) signature running north-northwest through the centre of the grid (Map 2). The southern extension of this horizon is interpreted to crop out 600 metres to the south as a 30-metre thick gossanous ankerite panel with anomalous gold on the ridge col east of Nea Peak. The panel splits into two structures at the north end of the IP grid. A subvertical western limb strikes north into hole ELD23-03 of the recently completed programme, which intersected almost 100m of siliceous, sulphide-bearing, iron-carbonate breccia, and veining that remains open to the north (assays pending). The eastern, more moderate-dipping limb strikes northeast and was intersected at shallow levels in historical drilling in holes ELD11-02 and 03. Both are also open in the down-dip direction.
The IP defines a significant zone of low resistivity and high chargeability at depth in the western portion of the survey area, forming a strong east-west root zone (Maps 3 and 4) that plunges gently to the west. This zone has no geological expression at surface, as it is under talus and till cover. This significantly stronger IP response (Map 5; metal factor) below the regional NNW striking, east-dipping panel suggests there is a deeper root zone of mineralization with higher sulphide concentrations, and therefore better gold content, that has yet to be tested by drilling. This is now the priority drill target on the project and the proposed drill plan for the next field season will be changed accordingly.
Next Steps: Extending the Geophysical Coverage and Re-evaluating Drill Targets
Based on the success of the 3D IP survey, the grid will be extended 600m to the southwest to Nea Creek, and one kilometre northwest past the Robson showing. The IP data indicates the sulphide content, and therefore gold, is highest in the new east-west root zone. This is now the priority drill target, and several proposed holes on the east flank of the main ridge will be moved to the west to test the IP metal factor anomaly at depths of 300-400 metres. The down-dip and north extension of the main gold-mineralized ankerite structure will also be tested at depth by holes in the Robson basin (Knoll Creek area).
Readers are cautioned that historical drilling and surface sampling results reported here should be viewed primarily as a guidance for future exploration drilling. The qualified person for this release has not done sufficient work to independently verify the historical sampling results described above.
References to other nearby mines and deposits made in this news release provide context for the Eldorado Project, which occurs in a similar geologic setting, but this is not necessarily indicative that the property hosts similar grades and tonnages of mineralization.
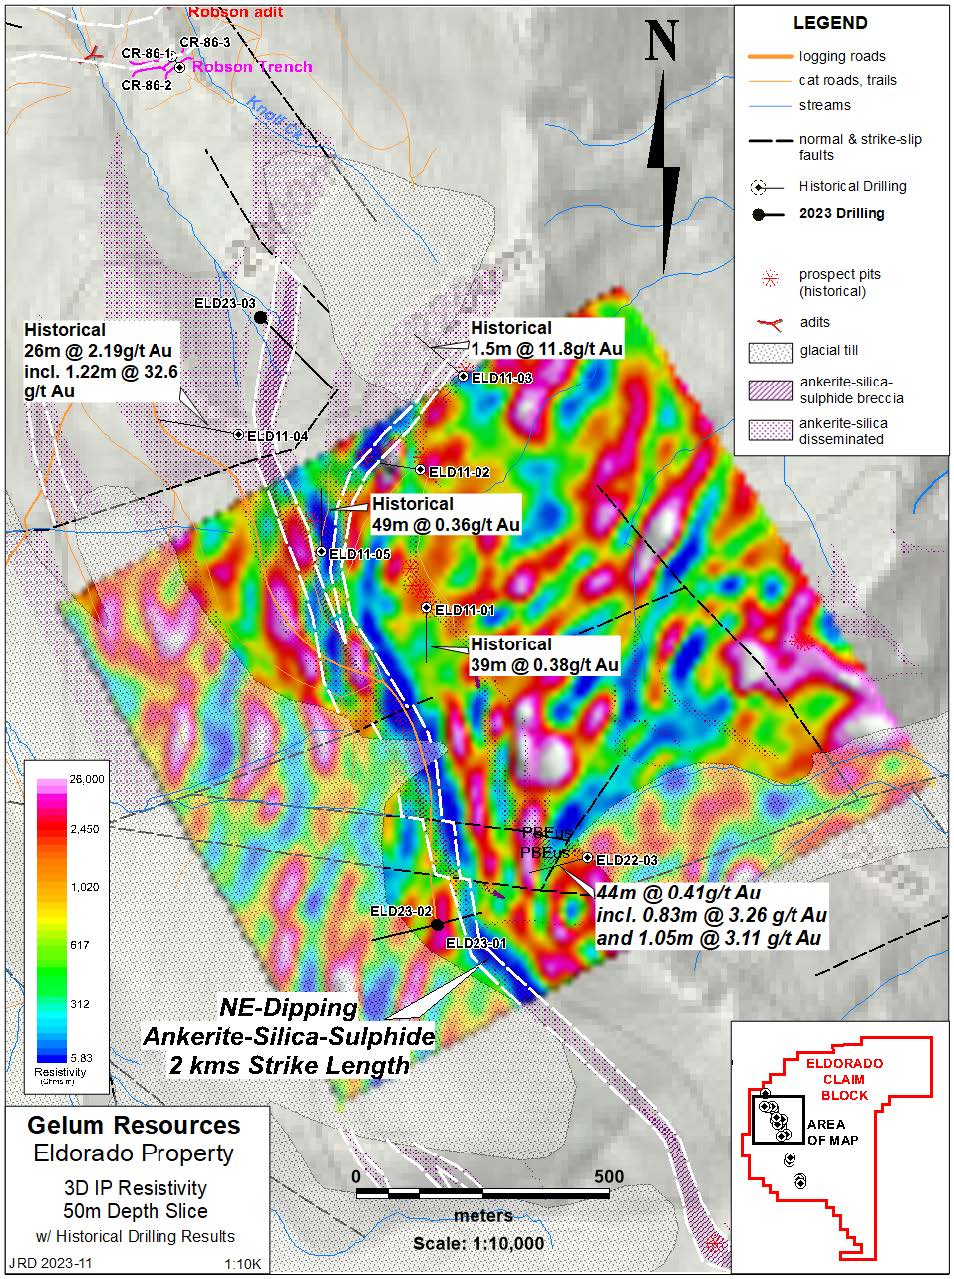
Map 2: 3D IP resistivity plan at 50m from surface, with highlighted intervals from previous drilling. The central resistance low is the down-dip expression of the main ankerite-silica-sulphide breccia panel and is open at the south and north edges.
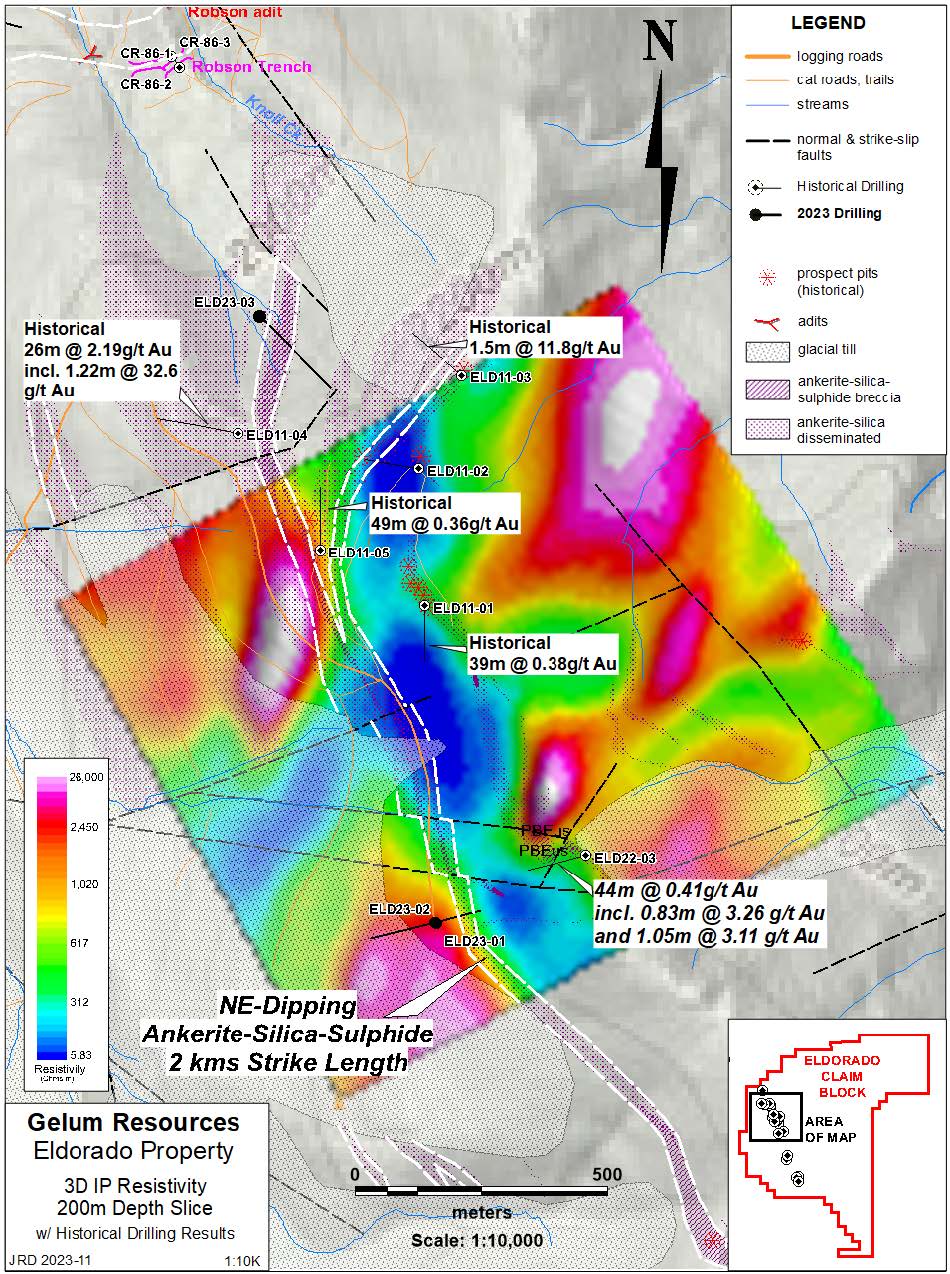
Map 3: 3D IP resistivity relief plan at 200m from surface. The east-dipping, main mineralized breccia has low-resistivity and thickens with depth in the central portion.
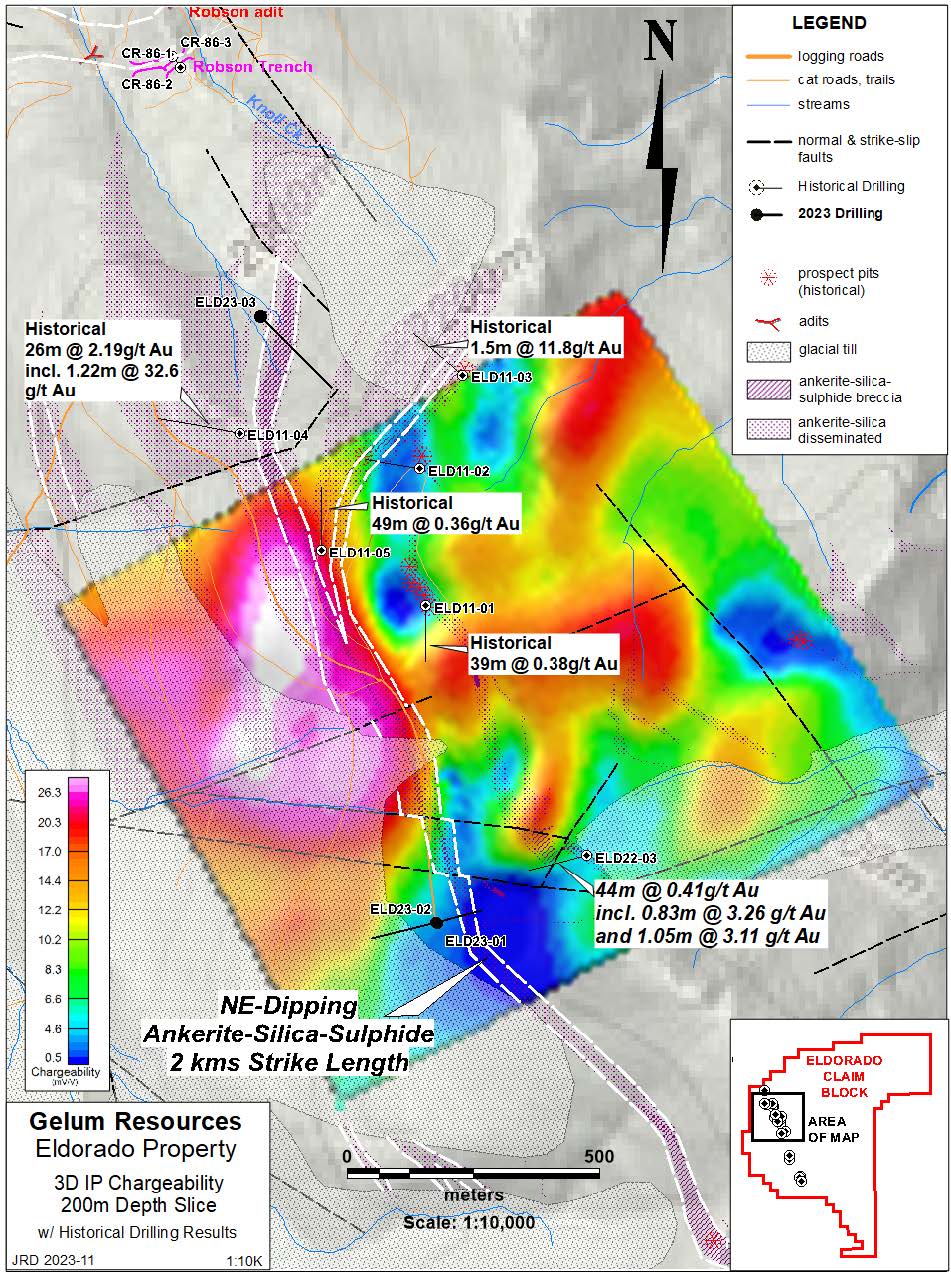
Map 4: 3D IP chargeability relief plan at 200m from surface, with highlighted intervals from previous drilling. Note the chargeability high is open on the west and north edges.
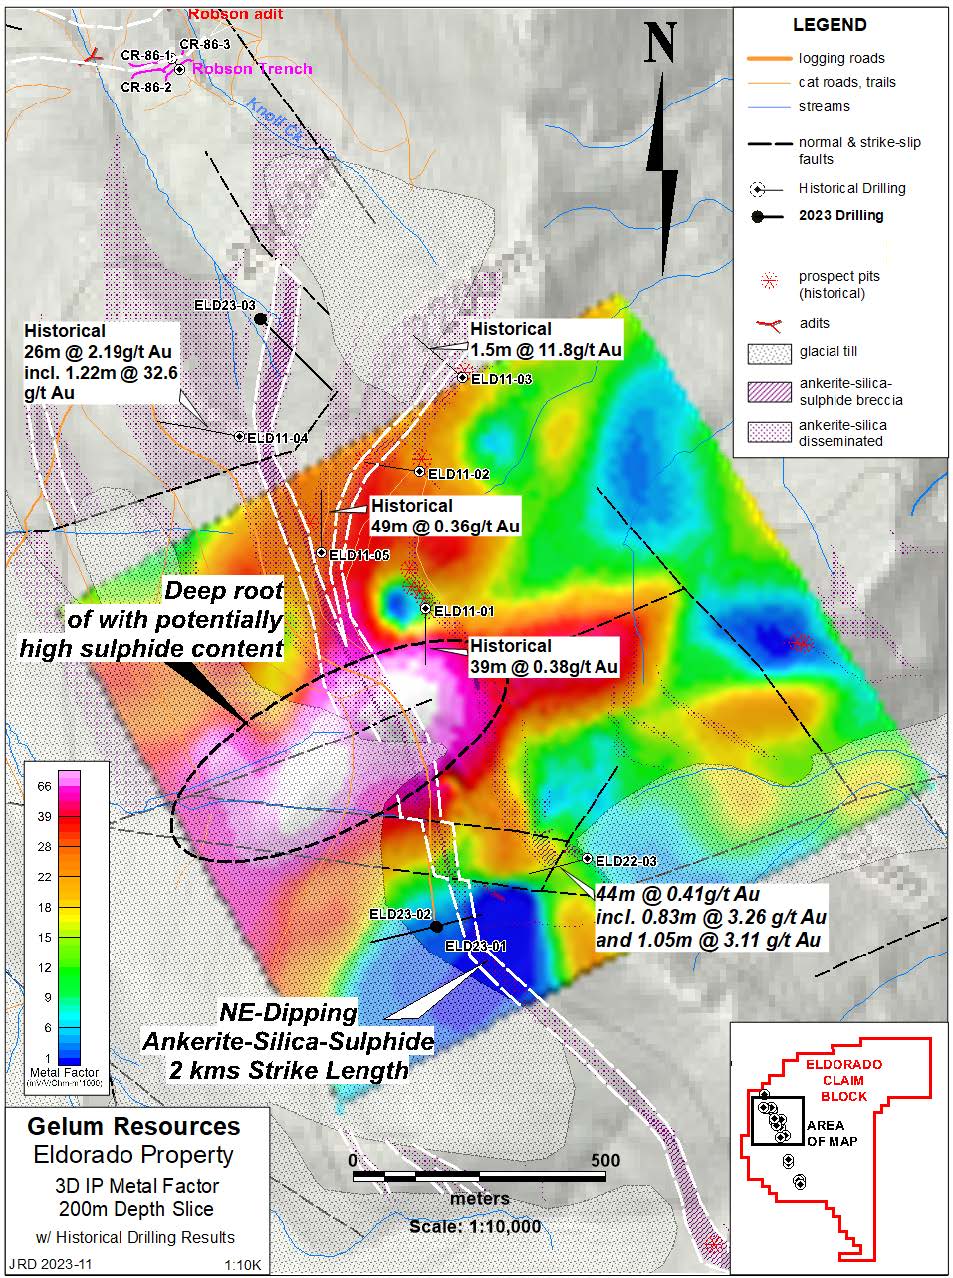
Map 5: 3D IP “metal factor” (MF = chargeability divided by resistivity) relief plan at 200m from surface. The MF anomaly is open on the west and north edges, with the strongest zone lying below and mostly outside drilling completed to date.
Qualified Person
John Drobe, P.Geo., a qualified person as defined by NI 43-101, has reviewed the scientific and technical information that forms the basis for this news release and has approved the disclosure herein. Mr. Drobe is not independent of the Company as he is a consultant of the Company.
About Gelum Resources Ltd.
Gelum Resources is a Company led by seasoned management and advisors in the mining and financial sectors. The Company’s objective is to define a multi-million-ounce economic gold deposit on the 9028-hectare Eldorado Gold Project, located within the Bralorne-Bridge River gold district, only 190 kilometres north of Vancouver and 74 km northwest of the town of Lillooet, B.C. The Bralorne mines historically exploited the largest, highest-grade, longest-producing lode-gold deposit in B.C. Management is proud to have developed an excellent working relationship with the Bridge River Indian Band (Xwísten) the project is within the traditional St’at’imc territory (Traditional Territory) in which Xwísten and its members assert, hold and exercise constitutionally protected Aboriginal Title and Rights (“Indigenous Title and Rights”).
For further information about the Company and its exploration portfolio, please refer to Gelum Resources latest Corporate Presentation.
Follow Gelum Resources online in the links below for additional updates:
- X (formerly Twitter)
- Sign Up for our Newsletter
On Behalf of the Board of Directors
Hendrik van Alphen, Director
For further information about Gelum, please contact:
Hendrik van Alphen (henk@hvana.com) or Marla Ritchie (marla@gelumresources.com)
Phone: 604 484-1228
Neither the CSE nor its Regulation Services Provider (as that term is defined in the policies of the CSE- Canadian Securities Exchange) accepts responsibility for the adequacy or accuracy of this release.
Forward-Looking Information:
This presentation contains forward-looking statements and forward-looking information (collectively, “forward- looking statements”) within the meaning of applicable Canadian and US securities legislation. All statements, other than statements of historical fact, included herein including, without limitation, statements regarding any potential increase in shareholder value through the acquisition of undervalued precious metal deposits for development, joint venture or later disposition, the potential to partner with mine developers to achieve production at any of the Company’s properties (existing or future); the potential for the capital costs associated with any of the Company’s existing or future properties to be low; the potential for the Company to outline resources at any of its existing or future properties, or to be able to increase any such resources in the future; concerning the economic outlook for the mining industry and the Company’s expectations regarding metal prices and production and the appropriate time to acquire precious metal projects, the liquidity and capital resources and planned expenditures by the Company, the anticipated content, commencement, timing and cost of exploration programs, anticipated exploration program results and the anticipated business plans and timing of future activities of the Company, are forward looking statements. Forward-looking statements are based on a number of assumptions which may prove incorrect, including, but not limited to, assumptions about the level and volatility of the price of gold; the timing of the receipt of regulatory and governmental approvals; permits and authorizations necessary to implement and carry on the Company’s planned exploration programs at its properties; future economic and market conditions; the Company’s ability to attract and retain key staff; and the ongoing relations of the Company with its underlying lessors, local communities and applicable regulatory agencies.
Accordingly, the Company cautions that any forward-looking statements are not guarantees of future results or performance, and that actual results may differ, and such differences may be material, from those set out in the forward-looking statements as a result of, among other factors, variations in the nature, quality and quantity of any mineral deposits that may be located, the Company’s inability to obtain any necessary permits, consents or authorizations required for its activities, material adverse changes in economic and market conditions, changes in the regulatory environment and other government actions, fluctuations in commodity prices and exchange rates, the inability of the Company to raise the necessary capital for its ongoing operations, and business and operational risks normal in the mineral exploration, development and mining industries, as well as the risks and uncertainties disclosed in the Company’s most recent management discussion and analysis filed with various provincial securities commissions in Canada, available at www.sedar.com. The Company undertakes no obligation to update publicly or release any revisions to these forward-looking statements to reflect events or circumstances after the date of this presentation or to reflect the occurrence of unanticipated events except as required by law. All subsequent written or oral forward-looking statements attributable to the Company or any person acting on its behalf are qualified by the cautionary statements herein.